
|
|  |
| |||
Introduction.Virusim is a powerful and complete deterministic epidemic simulator. It can simulate an epidemic and give you a lot of numerical and graphical results. You can simulate every epidemic you want, including the current coronavirus disease, and simulate the measures taken by the authorities. Screen examples.Virusim use three windows, one for the parameters, one for textual detailled information about the results of a simulation, one for the graphics, up to six different curves and different lines corresponding to special days.  The parameters of an epidemic simulation.  Curves draw with Virusim. In this example, the number of cases is maximum at day 80. Virusim can draw 6 different types of curves for each simulation. Comportemental model.You can found an introduction on comportemental models in epidemiology in this wikipedia page.
Usual models use three (SIR) or four (MSIR, SEIR, SEIS) states. Since april 22, 2020, Virusim use an internal model with six states:
people who have not encountered the virus (they are divided in two groups, some are vaccinated at the beginning of the epidemic, but not the others, so it is like
Virusim had seven states): 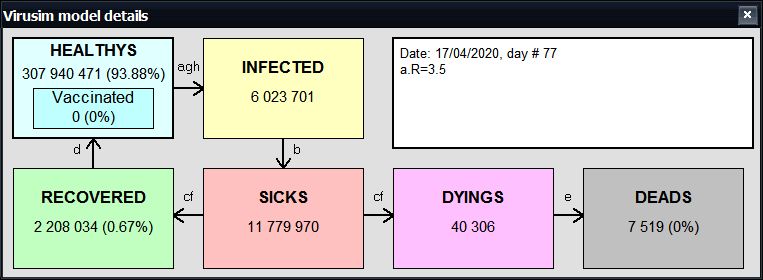 The states of the model used by Virusim, with result values for a given day. Virusim does not works internally with differential equations, but use an automate with this different states, or compartments, and simulate how people, and what number of people, go from one compartment to another, day after day, just as simple as they do in the real world. Despite this high number of states, Virusim remains simple to use, but this high number of states makes it accurate. With the good parameters, Virusim can gives results which are realy near a complex reality. In any case, Virusim approaches of course reality much better than a classic SIR model. Virusim can simulate the effects of social distancing or confinement decisions made by authorities. Famous epidemics simulationA simulator is a great tool to explore possibilities, and answer the question: "what will happen if?". For exemple, what will happen in France after may 11, when people are allowed to move around and work almost normally?
If we consider two cases (see above), one with Ro=1.2 and the other with Ro=0.9, Virusim shows that if Ro is slightly above 1, the number of cases will quickly increase again. If Ro remains slightly below 1, the epidemic will continue to decrease and slowly stops. 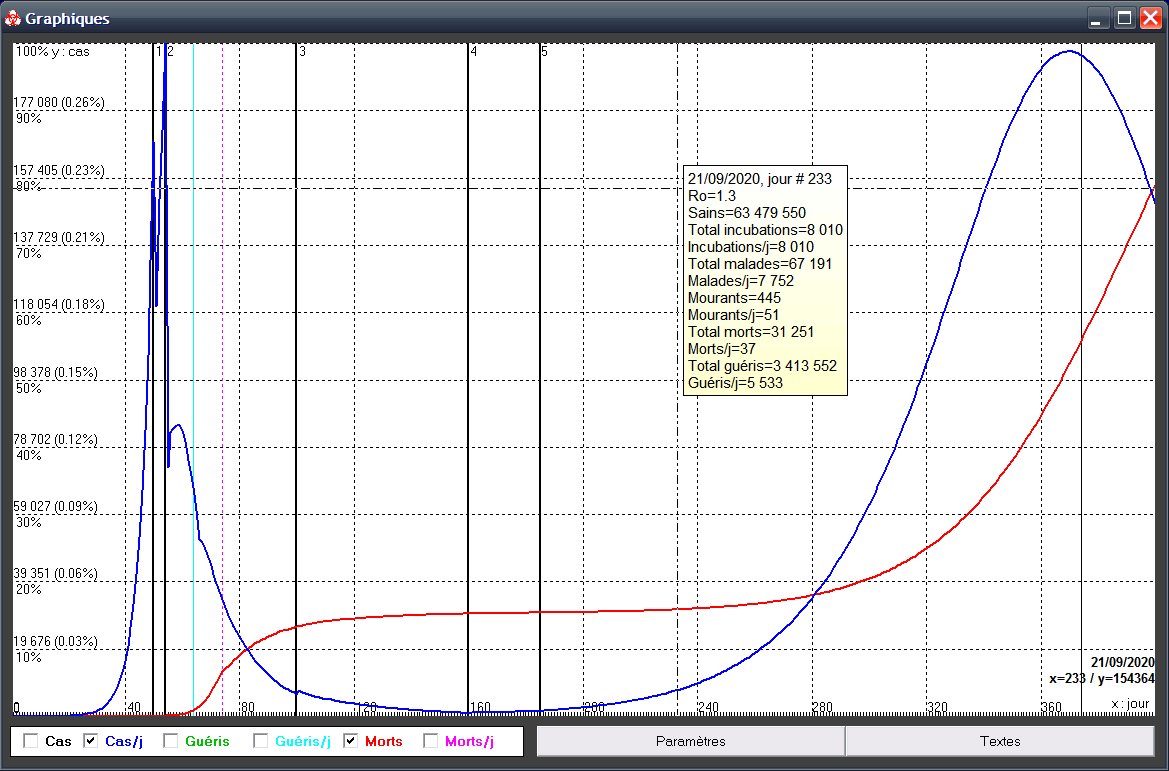 Coronavirus. Output for France. Simulation date: august 21, 2020. With Ro=1.3 after the 5th vertical black line, the number of daily cases will always be less than in the first wave, but the total number of deaths will increase after october 2020. Coronavirus. October 3, 2020 update: the previous projection from august 21, 2020, was right. Ro was between 1.25 and 1.3. The new projection for the future is obtained by setting Ro to its actual value, Ro=1.28 after the July 21, 2020.  Coronavirus. Output for France. Simulation date: October 3, 2020. The maximum number of cases would be reached on February 6, 2021, then the epidemic would gradually end. Coronavirus. November 6, 2020 update: a curfew as occured in the most important cities of the country, corresponding to the line number 7, just before a new confinment (line no 8). I give to Ro a value under one for this time. The new Ro changes the previous curves from November (see October update). The maximum number of cases on Februar disappear. The daily number of deaths will decrease after November 19 until the curfew ended (line n°9), then the epidemic will restart with Ro above one. With a third wave of cases, we are going to enter a "stop and go" type epidemic (see below).  Coronavirus. Output for France. Simulation date: November 6, 2020. Coronavirus. December 9, 2020 update: the main change is the announcement of the arrival of vaccines, and the forecast of vaccination of the population. In France, there would be 1 million people vaccinated in January and February, and 14 million more in March. In the graphical output below, this corresponds to lines 11 to 19 (nine bursts of vaccination, separated by ten days. A continuous vaccination can not be simulated). I suppose that the vaccination protects six days after the first injection, and that the epidemic restarts after December 15th, with a Ro=1.3, because of the relaxation of the restrictives measures. You can see that the vaccination of 14 million people, 21% of the population, has a great impact on the epidemic. The previous maximum of April disappears, and the epidemic stops. This simulation leads to 120,000 deaths in May 2021.  Coronavirus. Output for France. Simulation date: December 9, 2020. Coronavirus. May 2021 update: The evolution of the epidemic followed the forecasts made with Virusim. I stop following the epidemic in France. The epidemic is not over. There will be other waves, new variants, but after almost two years of follow-up, it is no longer worthwhile to continue. The SARS-COV-2 virus becomes a seasonal virus, such as flu. Don't forget that, in the coronavirus family, there are also some who give colds, well-known seasonal disease. Virusim showed me what it can do, and helped me, during these two years, to adapt me to what would happen, not to be surprised, and to protect me in the periods of strong contamination. I am proud of my little software. Stop and go:With restrictions, the epidemic artificialy decrease. When confinment orders are ended, the epidemic restart and, when there is a new wave of sicks in the hospitals,
restrictions come back, and so on until enough people have meet the virus or are vaccinated. The graphic below shows three successive periods of this phenomenon:  "Stop and go" with three periods of increasing/decreasing number of cases. It's only a possibility, not a prediction. The great bubonic plague of London in 1665 and 1666, was the last major plague epidemic in England.
At that time, there were approximately 375 000 residents in London. The plague has almost killed a quarter of them.  Simulation of the great plague in London in 1665.  Chart of mortality of the great plague in London in 1665-66 (Wikipedia). Download VirusimWorks with Windows Xp, 7, 8, 10.
| ||||


CommentsThere is no comment yet. Be the first to write one!
 |

|

|
||